
Fitting communities into forecast system topologies
Published:
“Does the removal of urchins and perrywinkles lead to brown water?” This question is one of hundreds of hypotheses I’ve encountered working with community groups on forecasting projects. It’s one of the reasons that community-centered science is fun. The ideas I encounter in communities are far more wide ranging than what’s found among scientists, who are also interesting, but are often much more in lock-step with each other (McClenachan et al. 2022).
Questions and ideas that come from communities can broaden the scientific perspective, but they can also give an indication of what is important to that community. To me, this resonates, at a time when we know science needs to be more equitable and inclusive. It’s especially pertinent to environmental forecasting, which can have direct impacts on communities.
So how can a community’s knowledge shape a forecasting system?
Thinking about this question took me down a strange rabbit hole recently. Or maybe it was more of a complex network of gopher holes. Or a termite mound. However esoteric, I popped out the other side with some new info.
The starting point was remembering that making a forecast is more than just solving a math problem. The techniquies of forecasting might be learned in a quantitative context, but a forecasting system is a social system. As a social system, there can be complex social dynamics, like reflexivity and environmental justice (Record et al. 2021, Wilson et al. 2023). There’s lots of potential for unintended consequences and other ethical pitfalls if the social dimensions are brushed over (Boettiger 2022, Hobday et al. 2019). There are plenty of cases where well-intentioned forecasts have caused harm (in aforementioned references).
But what does this forecasting / social system look like?
Most forecasting papers are mainly quantitative, but it’s common to include a figure that diagrams how the quantitative exercise–the forecasting algorithm–fits within a larger social context. For example, the “ecological forecasting cycle” traces steps from hypothesis generation to model building, uncertainty quantification, forecast generation and communication, assessment and updating, and back to hypothesis generation (Moore et al.2022). This system has communication to and feedback from groups that are influenced by the forecasts (generally managers). The cycle is taught and learned by forecasters as a way to iteratively improve forecasting systems within their social contexts.
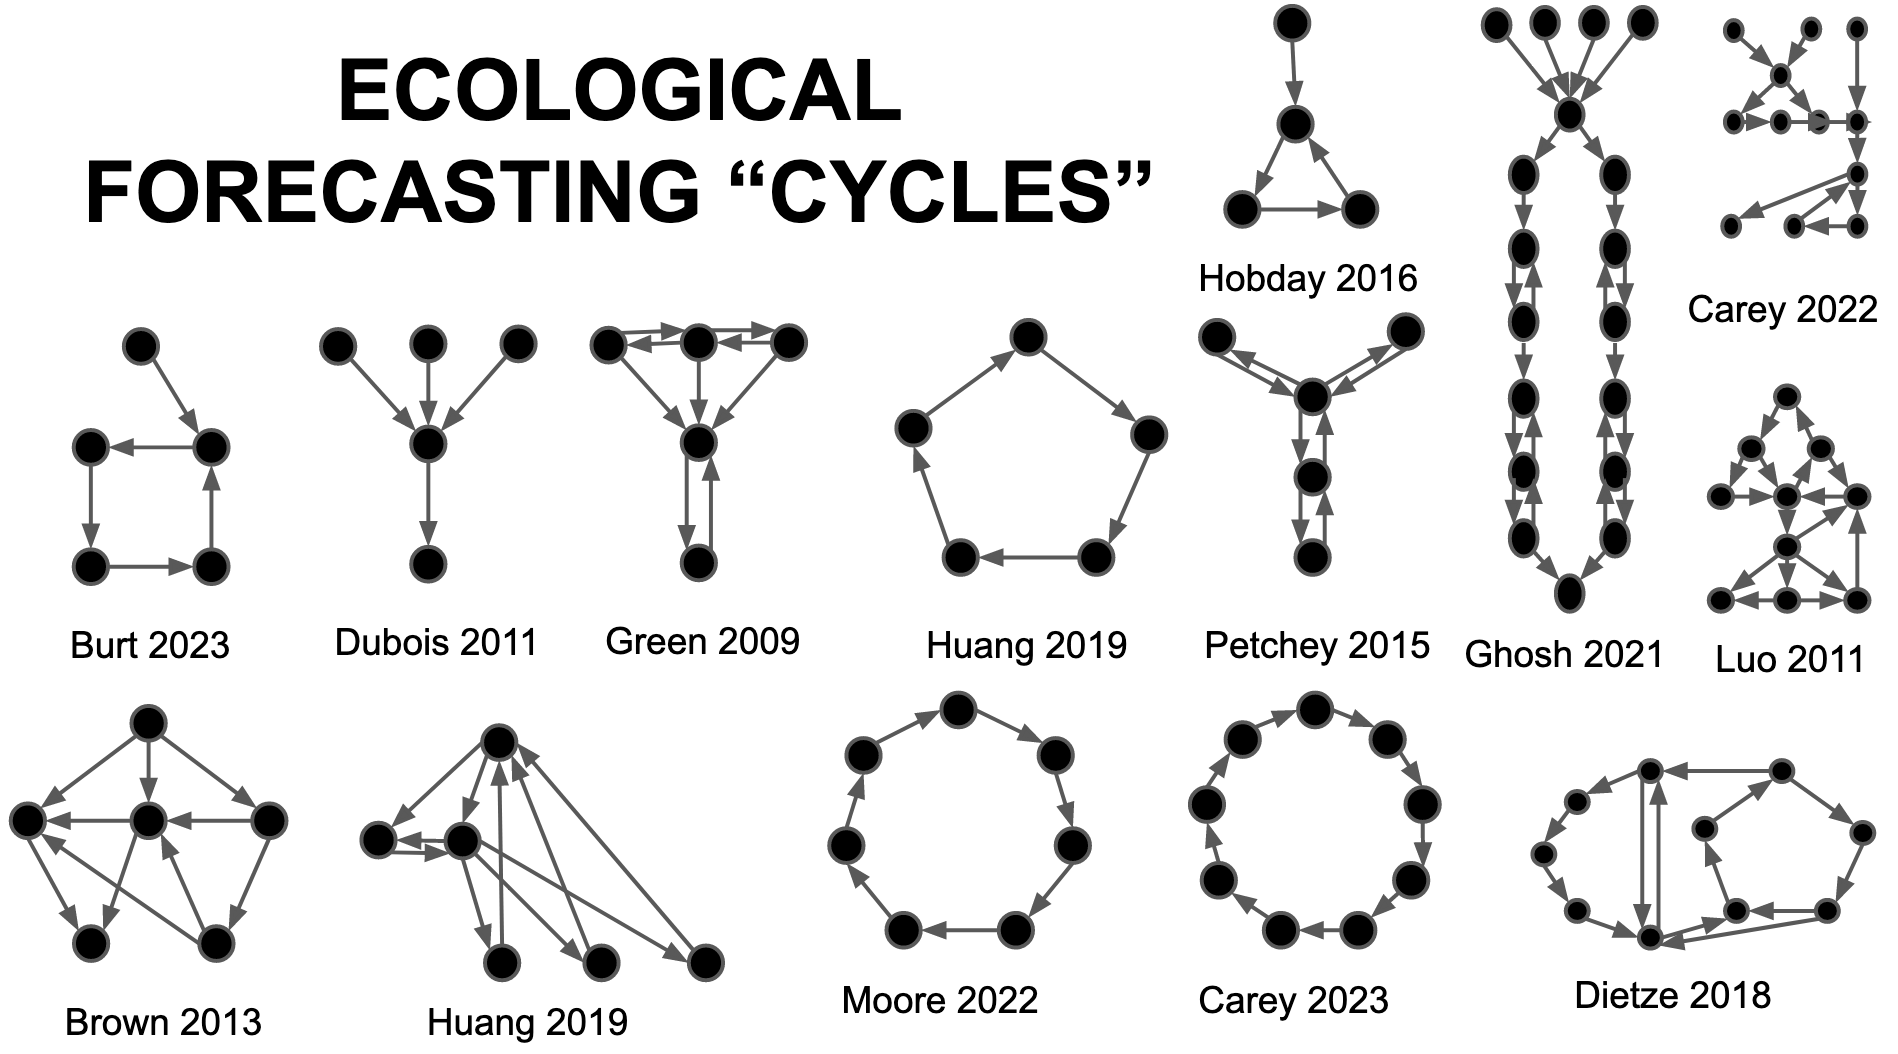
Figure 1 Some examples of topologies of ecological forecasting systems, diagrammed from the figures provided in a subset of the papers reviewed. Each figure was distilled as a graph based on nodes and edges indicated in the diagram.
A cycle is not the only model for diagramming a forecasting system within its social network. I reviewed twenty papers with flowcharts diagramming their forecasting systems for ecological forecasting. There’s a range of configurations, including pure cycles, unidirectional flows, trees, meshes, nearly fully connected graphs, and combinations of patterns (Figure 1). I like the one in the middle, from Petchey, that looks like a flux capacitor.
It might seem esoteric, but these so-called topologies of networks influence the flow of information and the resultant emergent knowledge. For example, stronger connectivity leads to faster consensus, and under certain conditions, regular networks (same number of edges and nodes) can increase the probability of reaching a less biased consensus (Fernandes 2023).
Some patterns emerged from an analysis of this collection of graphs. For example, larger graphs have larger diameters (Figure 2). To find the diameter of a graph, you look at the shortest distances between all pairs of vertices, and take the largest of those. There’s nothing that says the default for a large graph would have to be a large diameter–a well connected (or fully connected) large graph would have a small diameter. But for this group of papers, larger graphs did have larger diameters, which means information has to pass through many steps to get through the social network–steps where the information is not well connected with other parts of the system. My reading of this is that as we build larger forecasting systems that include more social components, we have a tendency to overlook the need for connectivity of these components.
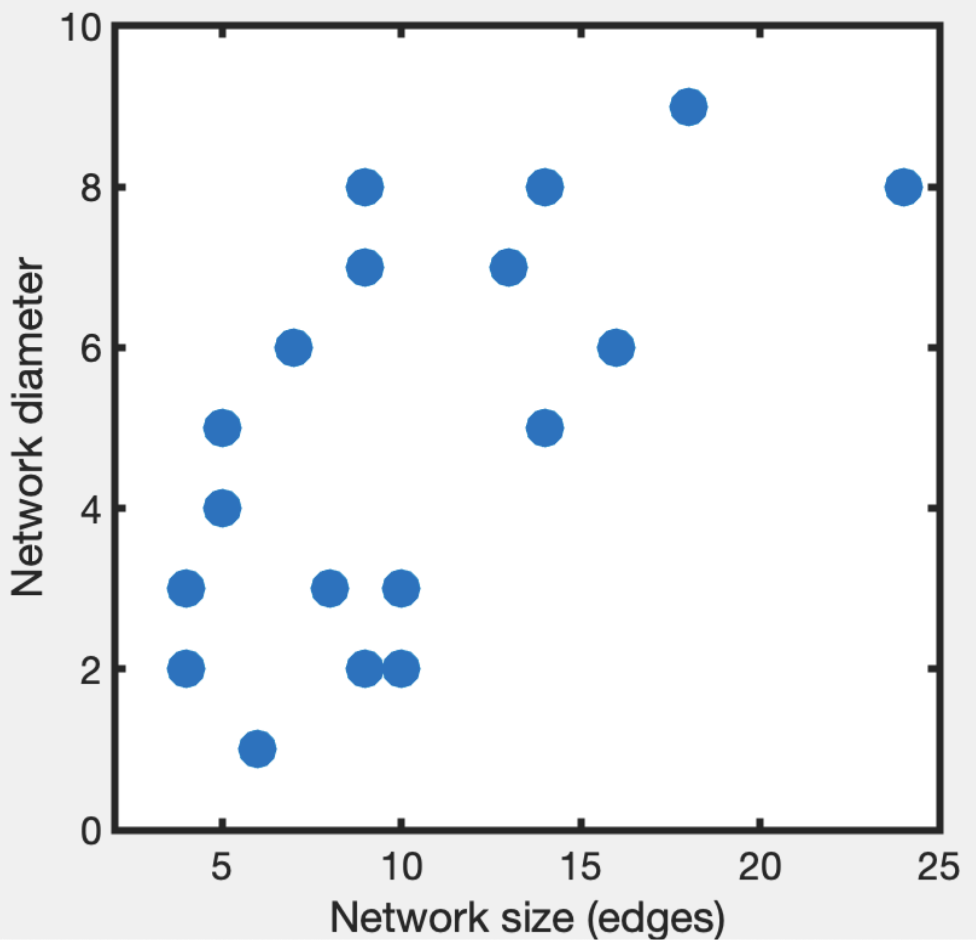
Figure 2 The relationship between network size (edges) and network diameter (greatest shortest node-node distance) across eighteen forecasting topologies (r = 0.64, p < 0.005).
This review informed a schematic that we put together to guide forecasting projects at the Tandy Center for Ocean Forecasting (Figure 3). The idea was to have a system that is fully connected, without long chains of arrows that information has to follow to get from one place to another. The system has properties that aim to reduce confirmation bias and speed consensus (Fernandes 2023)–i.e. full connectivity and regularity (equal number of nodes and vertices). In practice, the idea is to include forecast users and those influenced by forecast-based decisions–i.e. communities–as participants throughout the process. More details on this approach are in a draft technical document (Record 2022).
We don’t know for sure that our approach will lead to more equitable outcomes in forecasting. That’s just the working theory. There is an important trend in ocean science recognizing the role of co-producing knowledge through collaborations across social systems (Liboiron et al. 2021, Schreiber et al. 2022). The schematic shown here seeks to address issues of accessibility to forecasting science and practice. Ideas like, “Does the removal of urchins and perrywinkles lead to brown water?” should be able to propagate quickly through the network and be incorporated, or not, in a forecasting system. By centering communities of people who use or are influenced by forecasts, it can help to kick start forecasts in places that might be under-resourced or otherwise outside of the mainstream of ocean forecasting applications. And it will hopefully get their hypotheses and ideas into the mix.
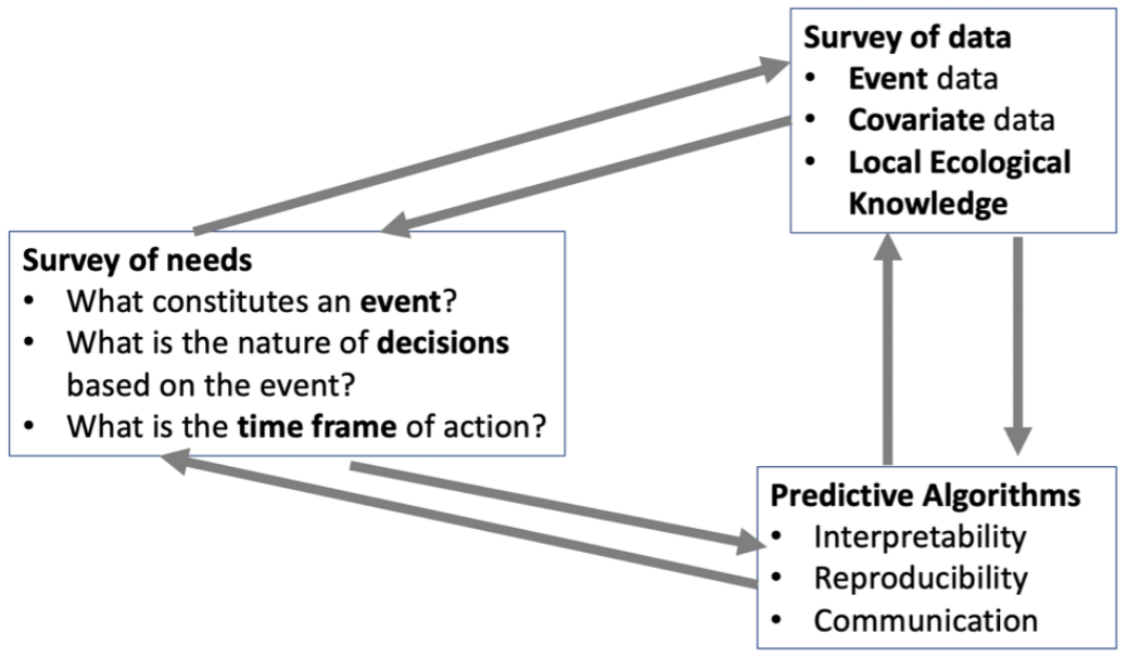
Figure 3 Schematic diagram of the framework used by the Tandy Center for building forecasting systems. Arrows indicate two-way movement between any of the components of the framework, potentially multiple times.
References
Boettiger C. The forecast trap. Ecology Letters. 2022 Jul;25(7):1655-64.
Fernandes MR. Confirmation bias in social networks. Mathematical Social Sciences. 2023 May 1;123:59-76.
Hobday AJ, Hartog JR, Manderson JP, Mills KE, Oliver MJ, Pershing AJ, Siedlecki S. Ethical considerations and unanticipated consequences associated with ecological forecasting for marine resources. ICES Journal of Marine Science. 2019 Sep 1;76(5):1244-56.
Liboiron M, Zahara A, Hawkins K, Crespo C, de Moura Neves B, Wareham-Hayes V, Edinger E, Muise C, Walzak MJ, Sarazen R, Chidley J. Abundance and types of plastic pollution in surface waters in the Eastern Arctic (Inuit Nunangat) and the case for reconciliation science. Science of the Total Environment. 2021 Aug 15;782:146809.
McClenachan L, Record NR, Waller J. How do human actions affect fisheries? Differences in perceptions between fishers and scientists in the Maine lobster fishery. Facets. 2022 Feb 10;7(1):174-93.
Moore TN, Thomas RQ, Woelmer WM, Carey CC. Integrating ecological forecasting into undergraduate ecology curricula with an R shiny application-based teaching module. Forecasting. 2022 Jun 30;4(3):604-33.
Record NR, Pershing AJ. Facing the Forecaster’s Dilemma: Reflexivity in Ocean System Forecasting. Oceans 2021 Nov 12 (Vol. 2, No. 4, pp. 738-751). MDPI.
Record N. Early Warning Systems for Harmful Algae: A Stakeholder-Centered Framework. 2022. DOI:10.13140/RG.2.2.24501.14568
Schreiber MA, Chuenpagdee R, Jentoft S. Blue Justice and the co-production of hermeneutical resources for small-scale fisheries. Marine Policy. 2022 Mar 1;137:104959.
Willson AM, Gallo H, Peters JA, Abeyta A, Bueno Watts N, Carey CC, Moore TN, Smies G, Thomas RQ, Woelmer WM, McLachlan JS. Assessing opportunities and inequities in undergraduate ecological forecasting education. Ecology and Evolution. 2023 May;13(5):e10001.